Где находится энергия в электрической цепи? Ложь и реальность
Оглавление
1.Введение
Современное образование формирует устойчивый шаблон мышления, согласно которому энергия источника питания непосредственно преобразуется в тепло, свет, движение и другие формы энергии. При этом окружающее пространство рассматривается как энергетическая пустота, не участвующая в передаче энергии. Как можно использовать энергию пространства, если её существование исключено из самой картиной мира?
Дрейфовая скорость свободных электронов в металлическом проводнике составляет всего 26 сантиметров в час — это медленнее, чем растёт трава. Если бы именно электроны переносили электрическую энергию, то её путь от электростанции до лампы в вашей комнате занял бы несколько лет.
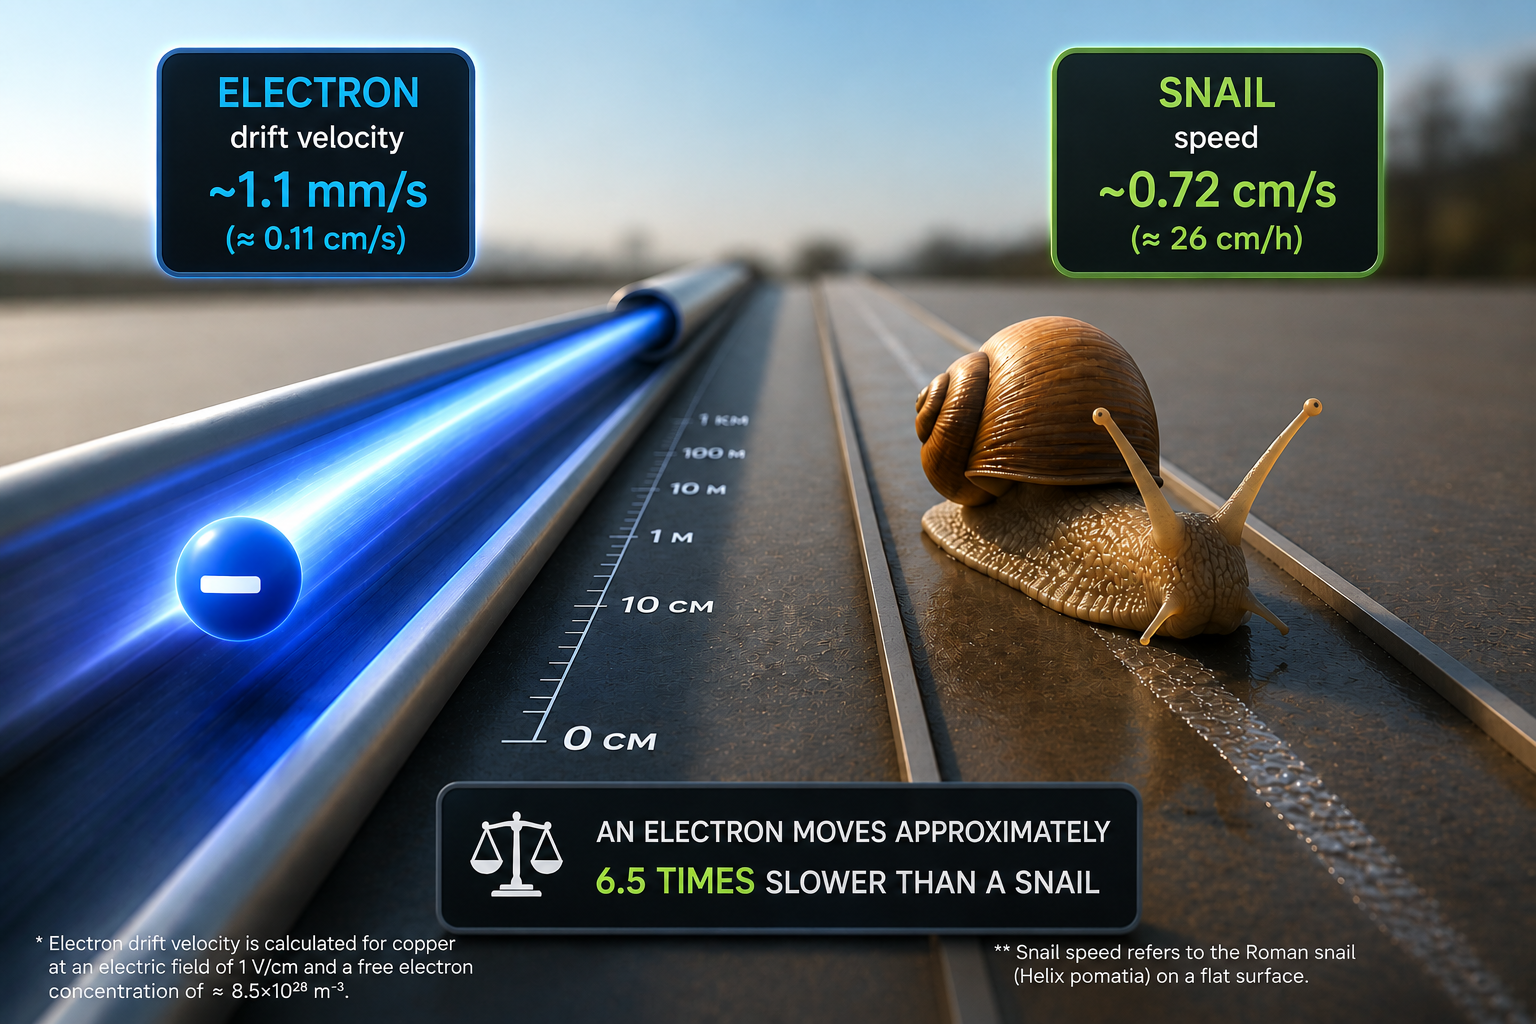
Рис. 1. Дрейфовая скорость электронов в проводнике. (Нажмите для увеличения до 4K)
Чтобы объяснить возникшее противоречие, была придумана искусственная модель, согласно которой металл проводника настолько плотно заполнен свободными электронами, что воздействие на один электрон передаёт импульс всей цепочке последующих электронов — подобно трубке, заполненной шариками. Однако возникает принципиальный вопрос: каким образом электроны «узнают», в каком направлении им необходимо двигаться — от одного полюса источника к другому, а не в противоположную сторону? Что создаёт первоначальный импульс и определяет направление последующего движения зарядов? Электронная модель не даёт ответа на этот вопрос.
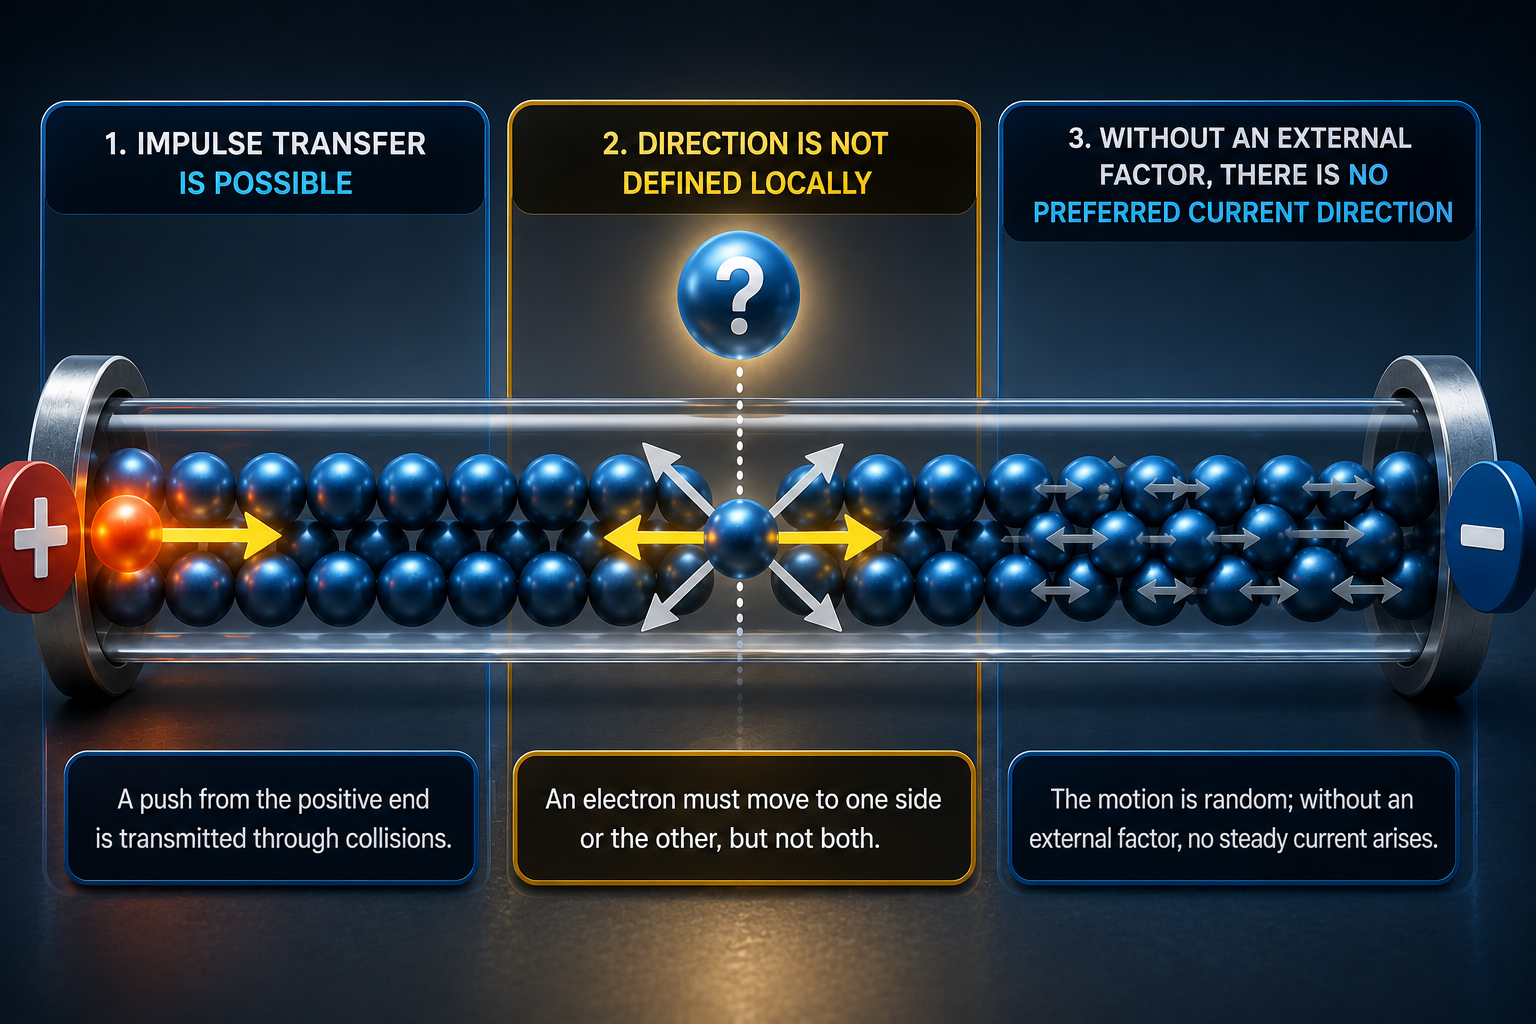
Рис. 2. Направление движения электронов в проводнике. (Нажмите для увеличения до 4K)
Ответ на вопрос о том, что создаёт первоначальное движение зарядов и определяет его направление, даёт электродинамика Джеймса Клерка Максвелла — британского физика, чьи уравнения легли в основу современной классической электродинамики и описывают взаимосвязь электрических и магнитных полей.
При замыкании электрической цепи мгновенно возникает электрическое поле. Электрическое поле не требует существования свободных носителей заряда и существует в тех областях пространства, где они отсутствуют.
Распространяясь вдоль проводника, электрическое поле вызывает перераспределение свободных зарядов, в результате чего на границе проводник–диэлектрик формируются поверхностные заряды.
Движение поверхностных зарядов создаёт магнитное поле. Направления электрического и магнитного полей подробно описаны в учебниках по электродинамике, но традиционное изложение принципов работы электрической цепи не рассматривает тот факт, что плотность потока электромагнитной энергии и её направление описываются вектором Пойнтинга S = E × H.
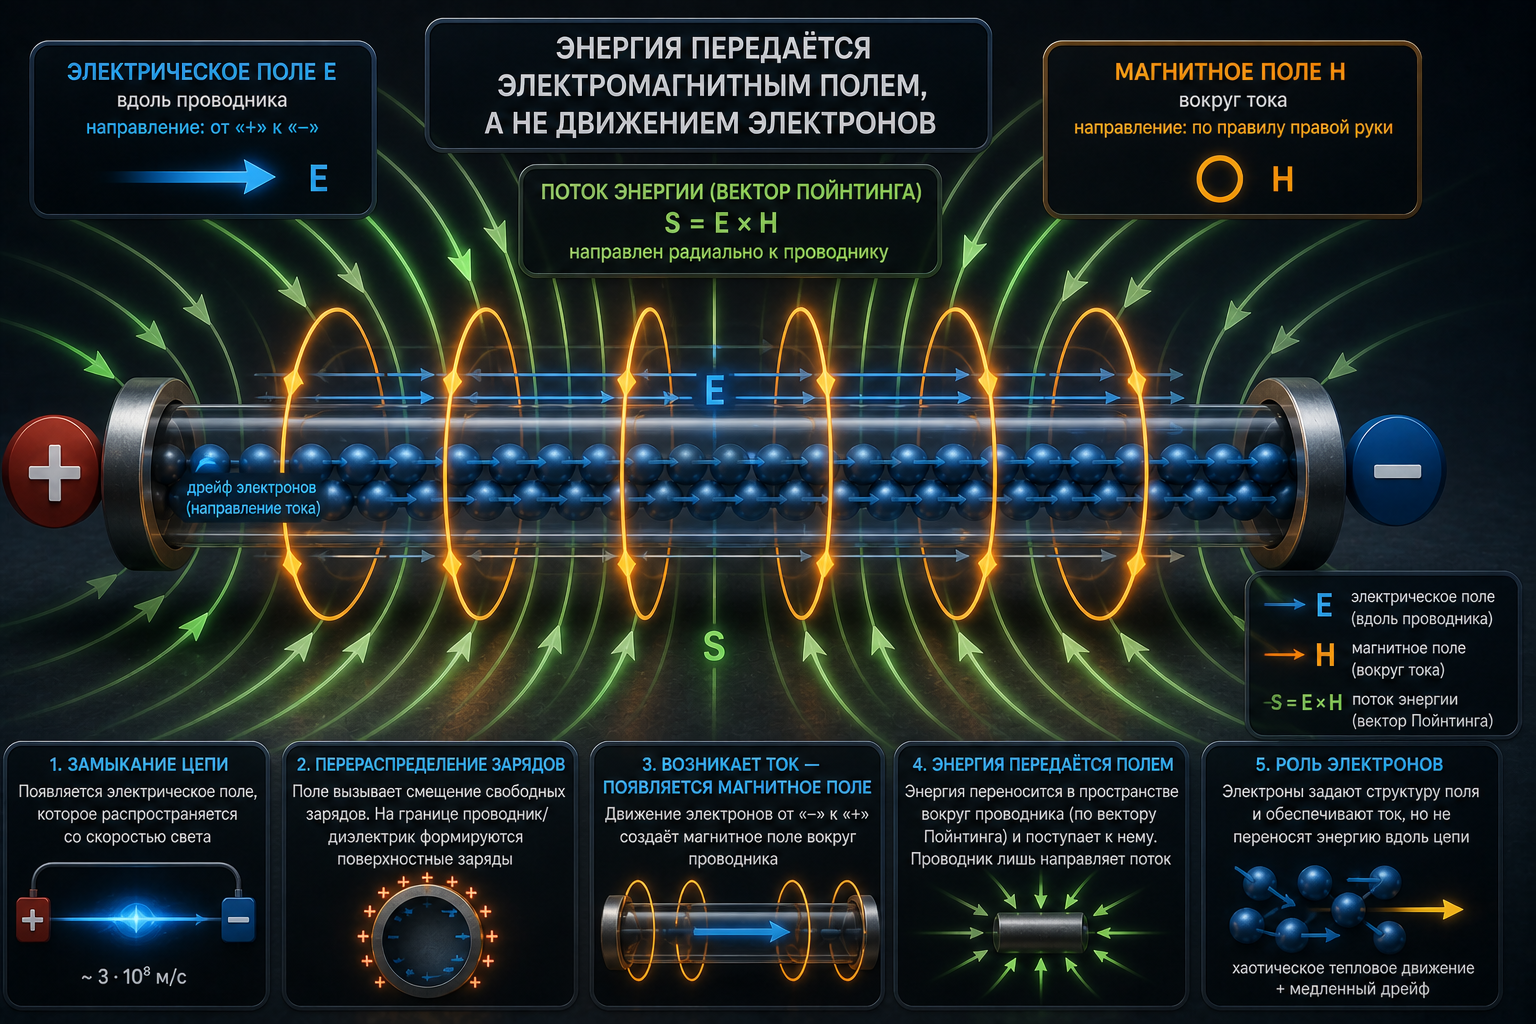
Рис. 3. Вектор Пойнтинга показывает поток энергии в проводник. (Нажмите для увеличения до 4K)
В 1884 году Оливер Хэвисайд, развивая представление о потоке электромагнитной энергии, описываемом вектором Пойнтинга S = E × H, показал, что в электрической цепи вектор Пойнтинга направлен из окружающего электромагнитного поля внутрь проводника. Электрический ток в проводнике формирует электрическое и магнитное поля, создавая условия для поступления энергии из окружающего пространства внутрь проводника.
▸ Ключевой вывод: энергия находится в окружающем пространстве в форме электромагнитного поля и не принадлежит источнику питания.
В отличие от ошибочных представлений, сформированных традиционным образованием, классическая электродинамика показывает, что энергия поступает из окружающего пространства в нагрузку, где образует другие формы энергии: тепло, свет и механическое движение.
Электродинамика Максвелла не только показывает, где находится энергия, но и определяет механизм, посредством которого эта энергия используется в электрической цепи. Данным механизмом является электродвижущая сила самоиндукции (ЭДС самоиндукции).
Согласно классической теории, ЭДС самоиндукции возникает при изменении электрического тока и описывается соотношением:
Это соотношение показывает, что величина ЭДС самоиндукции определяется скоростью изменения тока dI/dt и лежит в основе анализа явления самоиндукции в электрических цепях.
2. Подсказка Джеймса Максвелла
Классические электрические цепи основаны на замкнутых цепях с токами проводимости. Электродинамика Максвелла описывает более общий процесс — передачу энергии через электромагнитные поля, который не требует токов проводимости, например радиосвязь.
Как получить и использовать энергию, связанную с электромагнитным полем, применяя ЭДС самоиндукции для заряда конденсатора без создания замкнутого контура для тока проводимости, демонстрирует следующая схема:
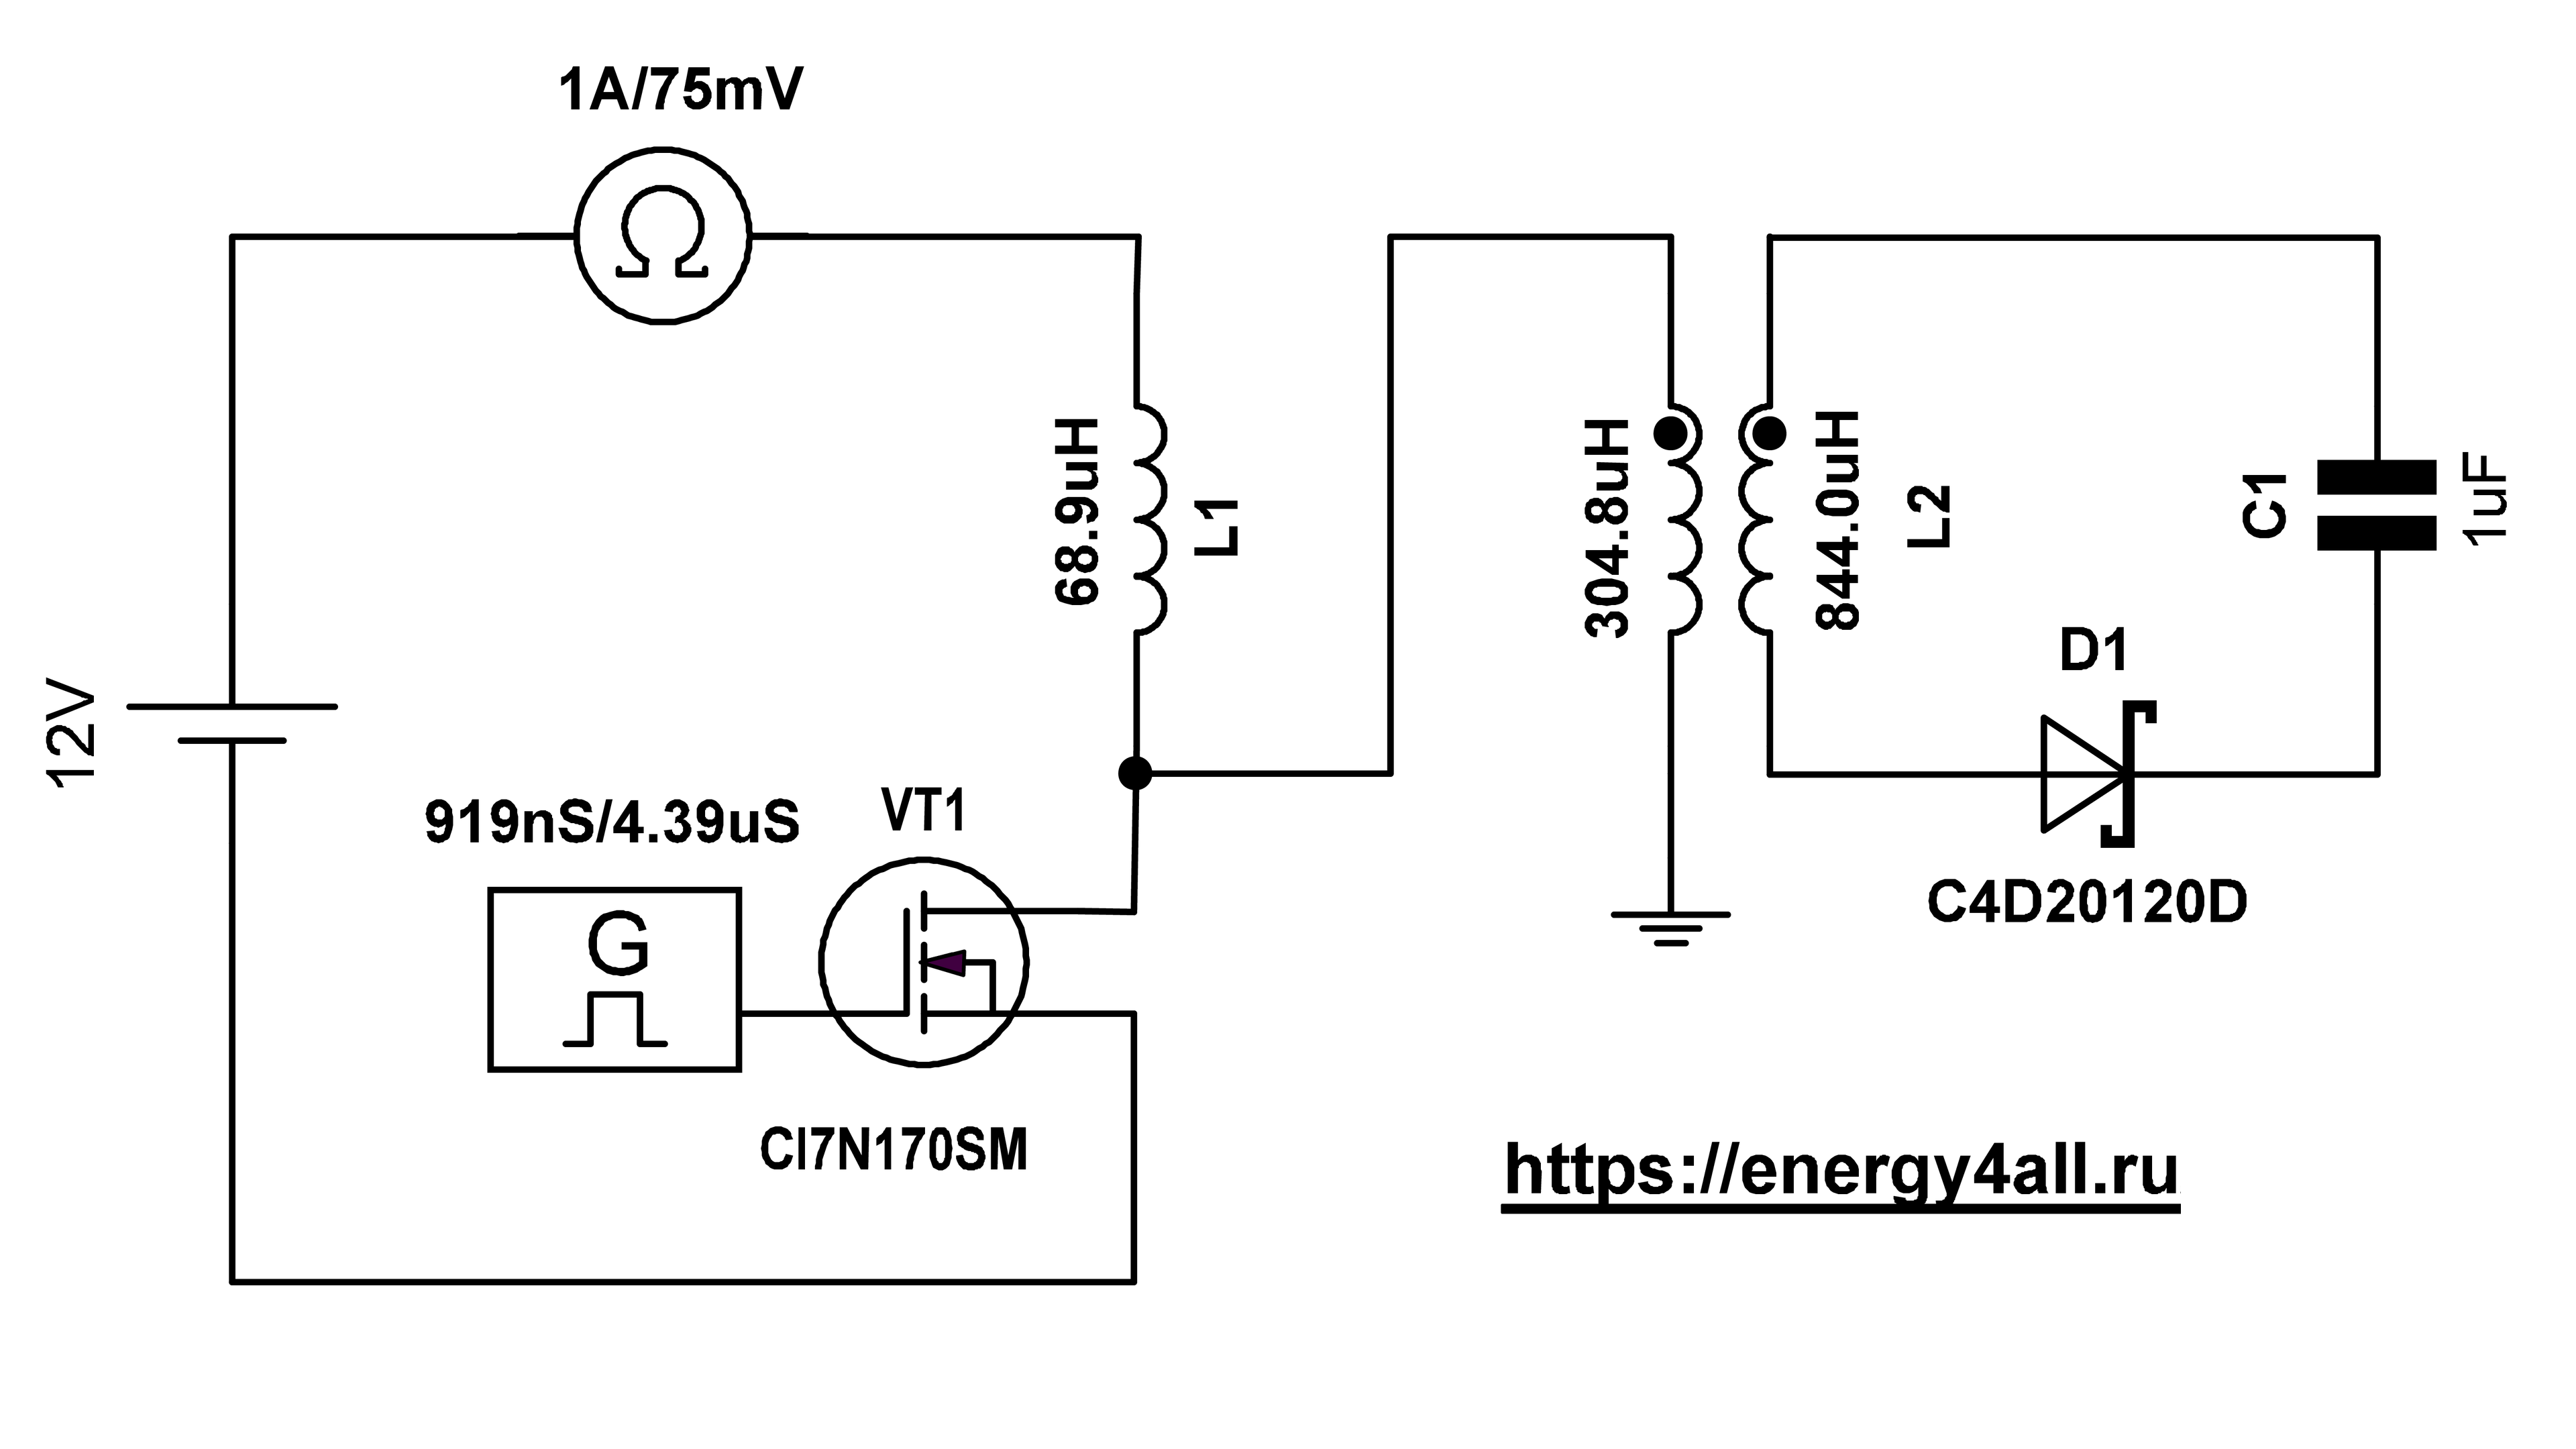
Рис. 4. Схема экспериментальной установки. (Нажмите для увеличения до 4K)
3. Элементы схемы
- Источник питания: ODP6033 — линейный источник питания с трансформатором на 50 Гц. Погрешность измерения тока: ≤ 0,1% + 8 мА. Для проверки повторяемости эффекта измерения также проводились с другими автономными источниками питания: автомобильным пусковым бустером, бензогенератором и ИБП TERMO 1012 (1000 Вт, 12 В). Эффект сохранялся во всех случаях.
- Ключ: Транзистор CI7N170SM с управляемой длительностью открытого состояния. Транзистор включён последовательно с катушкой L1 и разрывает соединение между L1 (68,9 мкГн) и отрицательным выводом источника питания.
- Заземление: Выполнено согласно ГОСТ отдельным проводником, не соединено с защитным заземлением питающей сети и используется только в пределах экспериментального стенда.
- Осциллограф: Siglent SDS1204X-E (полоса пропускания 200 МГц, частота дискретизации 1 Гвыб/с). Обеспечивает регистрацию импульсов с фронтами длительностью от 2–3 нс и выше. В экспериментах длительность фронтов составляла десятки наносекунд, поэтому искажения, связанные с ограничением полосы измерительного прибора, отсутствуют.
- Катушка L1: индуктивность 68.9 мкГн. Один её вывод подключён к плюсу источника, второй — к стоку транзистора.
-
Трансформатор с воздушным сердечником:
Первичная обмотка L2.1 (304,8 мкГн) одним выводом подключена к стоку транзистора. Второй вывод L2.1 имеет два режима подключения:
- свободный вывод (режим «без земли»);
- подключение к реальному заземлению (режим «с землёй»).
Вторичная обмотка L2.2 (844 мкГн) через диод Шоттки C4D20120D заряжает накопительный конденсатор ёмкостью 1 мкФ. Анод диода подключён к выводу L2.2, расположенному со стороны заземления.
Катушка L1 и трансформатор L2 физически разнесены и не имеют магнитной связи. Единственная связь между ними — электрическое соединение через сток транзистора.
Гальваническая развязка означает только отсутствие замкнутого пути для токов проводимости. Она не исключает взаимодействие между элементами через электромагнитное поле, токи смещения и передачу энергии через полевую структуру пространства.
4. Влияние земли на заряд конденсатора
В приведённом ниже видеоролике показана работа схемы и процесс её настройки. Демонстрируется не только восстановление энергетического баланса источника питания (баланс между потреблённой и возвращённой энергией стремится к нулю), но и увеличение заряда конденсатора при подключении внешнего электромагнитного окружения.
4.1. Результаты измерений
Режим без земли: При отсутствии заземления напряжение на конденсаторе ёмкостью 1 мкФ достигает примерно 12 В. Ток потребления от источника питания равен нулю. Энергия конденсатора:
Режим с землёй: После подключения заземления ток потребления от источника питания возрастает до 0,017 А. Это означает изменение энергетического баланса: схема начинает потреблять энергию от источника. Напряжение на конденсаторе при этом увеличивается до 100 В. Энергия конденсатора:
В следующей части видеоролика показано, что подбором частоты следования импульсов можно восстановить энергетический баланс между энергией, переданной в схему, и энергией, возвращённой обратно в источник питания. Состояние баланса контролируется по показаниям амперметра источника питания.
Частота с нарушенным балансом выбрана намеренно — для демонстрации процесса настройки. После настройки баланса напряжение источника питания увеличивается до 42 В. Это изменение не нарушает установленный баланс. Конденсатор заряжается до 306 В, при этом ток потребления остаётся равным нулю. Энергия конденсатора в этом режиме:
Сравнение с режимом без земли: 46800 / 72 ≈ 650
4.2. Что показывает ноль на амперметре?
Что показывает ноль на амперметре? Нулевое показание амперметра лабораторного источника питания OWON ODP6033 (а также других цифровых источников питания) не обязательно означает отсутствие тока. Оно указывает на баланс между энергией, переданной источником питания в схему, и энергией, возвращённой из схемы обратно в источник питания.
Встроенный амперметр в подобных экспериментах не следует интерпретировать как прямое измерение мощности, потребляемой схемой от источника питания. Нулевое показание означает лишь, что за интервал усреднения прибора переданная и возвращённая энергия равны; оно не означает отсутствия тока.
5. Физический механизм процесса
Физический механизм работы схемы известен и описан более 100 лет назад:
- 1861 г. — Дж. Максвелл вводит понятие тока смещения.
- 1865 г. — опубликована «Динамическая теория электромагнитного поля».
- 1873 г. — выходит «Трактат об электричестве и магнетизме».
- 1884 г. — Дж. Пойнтинг вводит вектор плотности потока энергии.
В процессе закрытия транзистора в точке разрыва цепи (сток транзистора) возникает изменяющееся электрическое поле. При подключении заземления электрическое поле распространяется вдоль проводника между стоком транзистора и точкой заземления. Электрическое поле в проводнике приводит к формированию поверхностных зарядов, которые задают граничные условия для электрического поля E в окружающем пространстве. Распределение поверхностных зарядов определяется уравнениями Максвелла и уравнением непрерывности ∂ρ/∂t + div J = 0, выражающим закон локального сохранения электрического заряда.
Изменение электрического поля формирует ток смещения, который, согласно уравнению Максвелла–Ампера, определяет ротор магнитного поля, задаваемый уравнением curl H = J + ∂D/∂t. Таким образом, ток смещения создаёт вихревое магнитное поле H в окружающем пространстве, вектор которого направлен по касательной к поверхности проводника.
Вектор Пойнтинга, S = E × H, определяется электрическим и магнитным полями E и H. При наличии нагрузки он направлен из окружающего пространства в проводник. Это указывает на то, что электромагнитная энергия поступает в нагрузку из окружающего поля, а не переносится по проводнику. Энергию, поступающую в конденсатор, не следует считать происходящей из заземления.
В гальванически развязанной цепи L2.1 ток проводимости отсутствует — нет замкнутого пути для движения зарядов. Энергия в L2.2 индуцируется в результате переноса энергии из внешнего пространства в L2.1. В замкнутой цепи L2.2 — диод — конденсатор образуется ток проводимости, который выпрямляется диодом и накапливается в конденсаторе.
Согласно закону электромагнитной индукции Фарадея — Максвелла, dI/dt (изменение тока в катушке L1, вызванное резким закрытием транзистора) является дополнительным источником энергии: она создаёт ЭДС самоиндукции, которая формирует импульс высокого напряжения. Импульс напряжения не может существовать без тока проводимости — это обратный ток (13,3 А), который возвращается в источник питания через замкнутую цепь, образованную обратным диодом и ёмкостью перехода транзистора или токами смещения.
Источник питания создаёт условия для формирования полевой структуры «сток транзистора — земля». Одновременно с этим динамика изменения тока в катушке L1 (dI/dt) формирует возвратный ток, который подбирается таким образом, чтобы получить баланс между энергией, взятой от источника питания, и вернувшейся обратно, ориентируясь на нулевой ток потребления источника питания либо на увеличение заряда аккумуляторной батареи.
6. Список литературы
- Igal Galili, Elisabetta Goihbarg. Energy transfer in electrical circuits: A qualitative account.
- Richard P. Feynman. The Feynman Lectures on Physics, Vol. II, Chapter 27. Field Energy and Field Momentum.
- Matar M., Welti R. Surface charges and J. H. Poynting's disquisitions on energy transfer in electrical circuits.
- Basil S. Davis, L. Kaplan. Poynting Vector Flow in a Circular Circuit.
- Poynting vector. Electromagnetic energy flux.
- Oliver Heaviside. Contributions to electromagnetic theory and energy flow.
- James Clerk Maxwell. Electromagnetic theory.
- Maxwell's equations and electromagnetic field theory.
